p1_df2<- df2 |>
ggplot(aes(
xmin= 0,
xmax = price,
y = rank,
ymin = rank - 0.45,
ymax = rank + 0.45,
group = runame,
fill = category))+
geom_rect(alpha = 0.5) +
facet_wrap(~date) +
facet_null() +
scale_x_continuous(
limits = c(0,40000),breaks = seq(0, 40000, 5000),
labels = function(x) paste0(x/1000, "k"),
expand = expansion(c(0.05, 0.02)))+
geom_image(aes(x=price, image = images), x= 0, size = 0.1)+
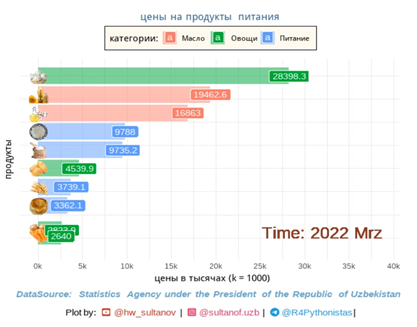
geom_text(aes(label = paste("Time:", format(date, "%Y %b"))),
x = 32000, y = 1.5, size = 6, color = "tomato4")+
geom_label(aes(x = price, label = as.character(price)), colour = "white")+
labs(title = t2,
subtitle = "DataSource: ©Агентство статистики при Президенте Республики Узбекистан",
caption = social_caption_map,
x = "цены в тысячах (k = 1000)", y = "продукты",
fill = p2)+ # legend title
theme_minimal()+
theme(
plot.title = element_text(size = 16, color = "steelblue4", hjust = 0.5),
plot.subtitle = element_text(size = 14, color = "tomato4", hjust = 0.5),
plot.caption = element_textbox_simple(
size = 12,
lineheight = 1,
padding = margin(5.5, 5.5, 5.5, 5.5),
margin = margin(0, 0, 5.5, 0),
hjust = -0.5,
fill = "cornsilk"), #
axis.ticks.y = element_blank(),
axis.text.y = element_blank(),
# panel.grid.major.y = element_blank(),
# panel.grid.minor.y = element_blank(),
legend.position = "top",
legend.box.background =element_rect("floralwhite")) +
transition_reveal(date)+
enter_fade() +
exit_fade()
p1_df2
# anim_2 <- p1_df2 |>
# animate(
# duration = 20,
# fps = 10,
# start_pause = 5,
# end_pause = 5,
# # height = 530, #530
# #width = 844, #633
# #rewind = TRUE,
# renderer = av_renderer()
# )
# anim_2